
Because there are obvious differences between white bread and pure glucose, glycemic indexes determined for foods using those different standards can vary. The glycemic index scale is 0 to 100 when using glucose as the standard; this scale is more common because it is easier to understand and apply. Meanwhile, when white bread is used as the standard, the scale can be a little less user-friendly, because some foods, such as baked potatoes, rice cakes, and many breakfast cereals, will have a glycemic index exceeding 100.
The glycemic index of a food is influenced by several factors, including carbohydrate type and other nutrients that can influence rate of digestion or absorption. Because only half of the monosaccharide units in lactose and sucrose are glucose, whereas all of the monosaccharides in starch are glucose, this suggests that “starchy” foods, such as a baked potato, might have a higher glycemic index than milk and dairy foods and many “sugary” foods, such as candies. Fruits and honey with high fructose content only have a moderate impact on blood glucose. Meanwhile, the level of protein, fat, and fiber in a food can lower the glycemic index of a food by slowing the rate of digestion and absorption of monosaccharides. If mono- saccharides are absorbed more slowly, there is more opportunity for the liver to remove them before they reach the general circulation. This helps explain why whole wheat bread can have a lower glycemic index than white bread.
Glycemic Load
The concept of glycemic index is simple to grasp; however, it is not always easy to apply to how people tend to eat. One issue with glycemic index is that the amount of food used to determine it is not the amount typically consumed by people. For instance, boiled carrots have a glycemic index of about 90; however, it would take over 10 cups of carrots to achieve the 50 grams of carbohydrate needed for the glycemic index test. For this and other reasons, a second glycemic measure more appropriate for the real world, called glycemic load, is used.
Glycemic load is basically glycemic index normalized to serving standards. A food’s glycemic load is derived by multiplying a food’s glycemic index by the amount of digestible carbohydrate in a serving and then dividing by 100. For instance, carrots have a glycemic index of 90, which, multiplied by 4 (the grams of digestible carbohydrate in 1 cup) and divided by 100, gives one a glycemic load of roughly 4.
Foods with a higher glycemic index (and, more applicably, glycemic load) may be undesirable food choices for people with chronic hyperglycemia (e.g., diabetes mellitus). First, the higher glycemic index food can worsen a hyperglycemic state. Second, further elevation of circulating glucose could lead to an increase in the level of circulating insulin (hyperinsulinemia). For many hyperglycemic people, insulin may already be circulating at normal or elevated levels relative to the blood glucose concentration. Chronic hyperinsulinemia is associated with elevated blood lipids (hypercholesterolemia and hypertriglyceridemia), blood pressure, and body fat.
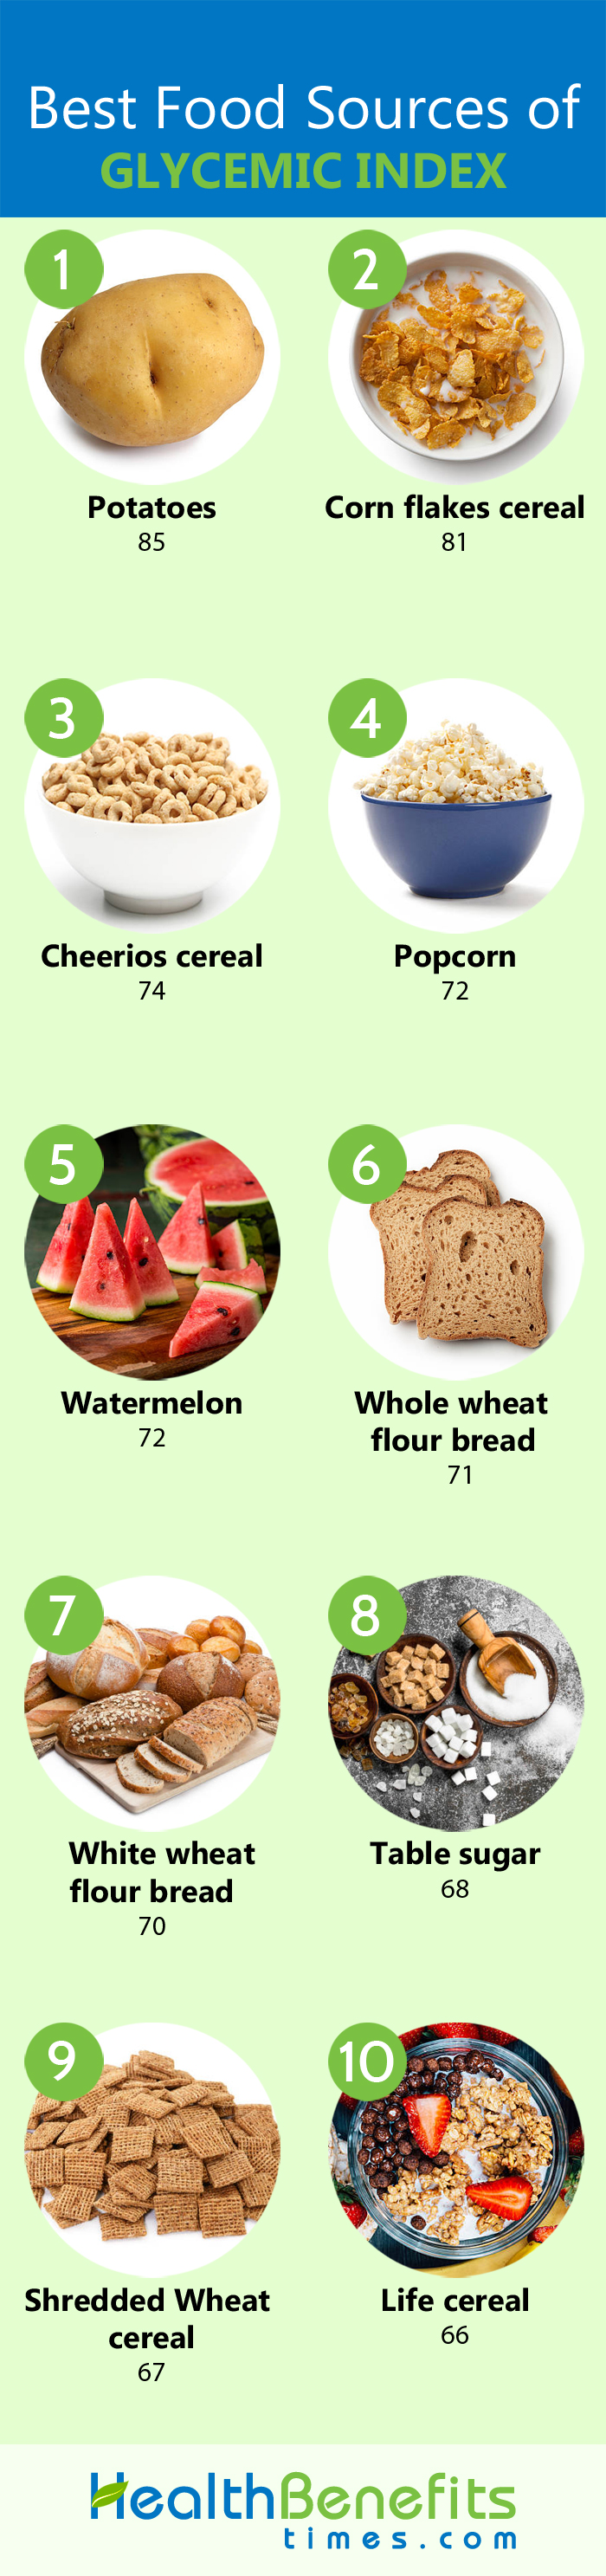
| Food | Glycemic Index | Glycemic Load |
| Potatoes (Russet, baked) | 85 | 26 |
| Corn flakes cereal | 81 | 21 |
| Cheerios cereal | 74 | 15 |
| Popcorn | 72 | 8 |
| Watermelon | 72 | 4 |
| Whole wheat flour bread | 71 | 9 |
| White wheat flour bread | 70 | 10 |
| Sucrose (table sugar) | 68 | 7 |
| Shredded Wheat cereal | 67 | 13 |
| Life cereal | 66 | 16 |
| Cantaloupe | 65 | 4 |
| Couscous | 65 | 23 |
| Beets | 64 | 5 |
| Rice, white | 64 | 23 |
| Sweet potatoes | 61 | 17 |
| Pineapple | 59 | 7 |
| Potatoes (new) | 57 | 12 |
| Wild Rice | 57 | 18 |
| Buckwheat | 54 | 16 |
| Sourdough wheat bread | 54 | 15 |
| Sweet corn | 54 | 9 |
| Bananas | 52 | 12 |
| Linguine | 52 | 23 |
| Green peas | 48 | 3 |
| Carrots | 47 | 3 |
| Macaroni | 47 | 23 |
| Grapes | 46 | 8 |
| All-bran cereal | 42 | 8 |
| Spaghetti | 42 | 20 |
| Apple juice | 40 | 11 |
| Fettuccine | 40 | 18 |
| Strawberries | 40 | 1 |
| Pinto beans | 39 | 10 |
| Apples | 38 | 6 |
| Navy beans | 38 | 12 |
| Pears | 38 | 4 |
| Kidney beans | 28 | 7 |
| Peanuts | 14 | 1 |
| Level | Glycemic Index | Glycemic Load | Glycemic Load/Day |
| Low | ≤55 | ≤10 | <80 |
| Medium | 56–69 | 11–19 | 80–120 |
| High | ≥70 | ≥20 | >120 |
Comments
comments